GBPUSD TRADE IDEA GBPUSD Short Pound Sterling vs US Dollar
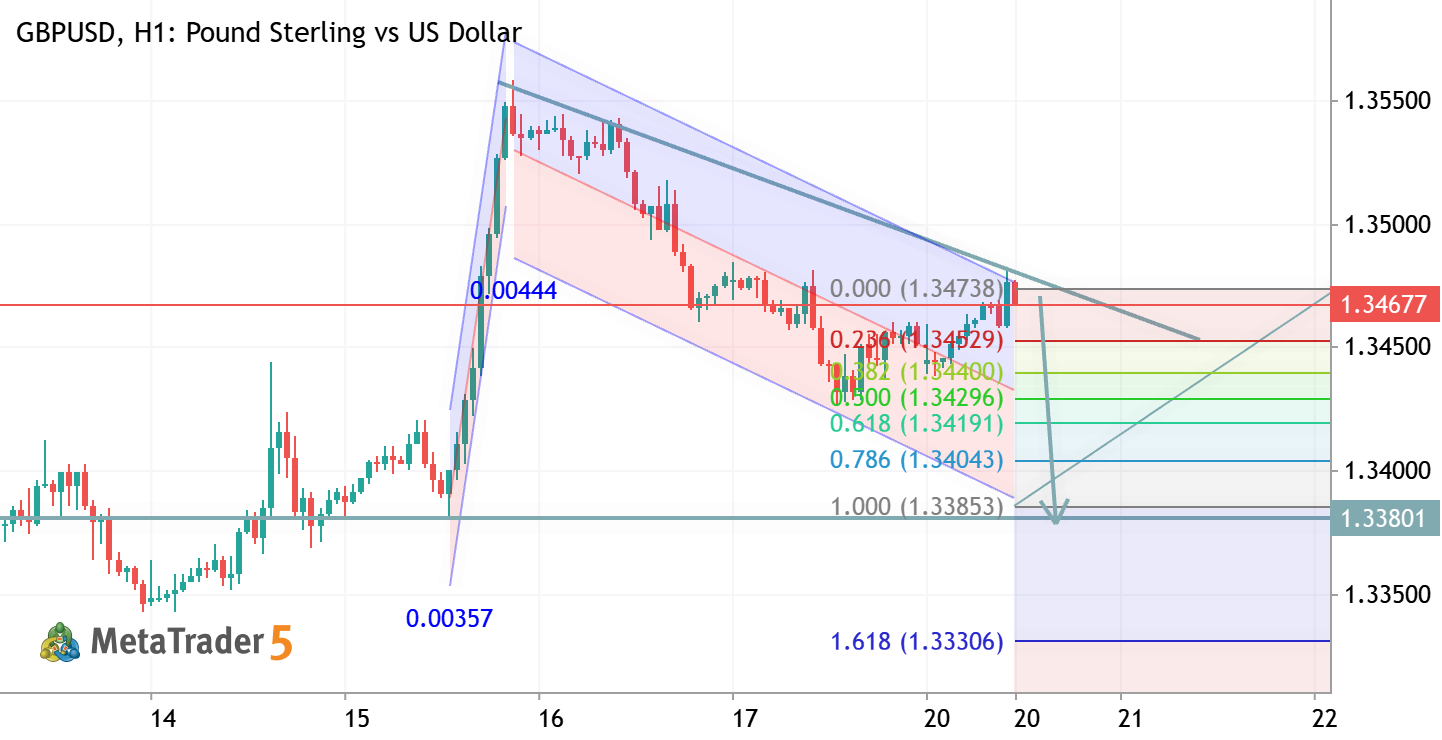
GBPUSD TRADE IDEA
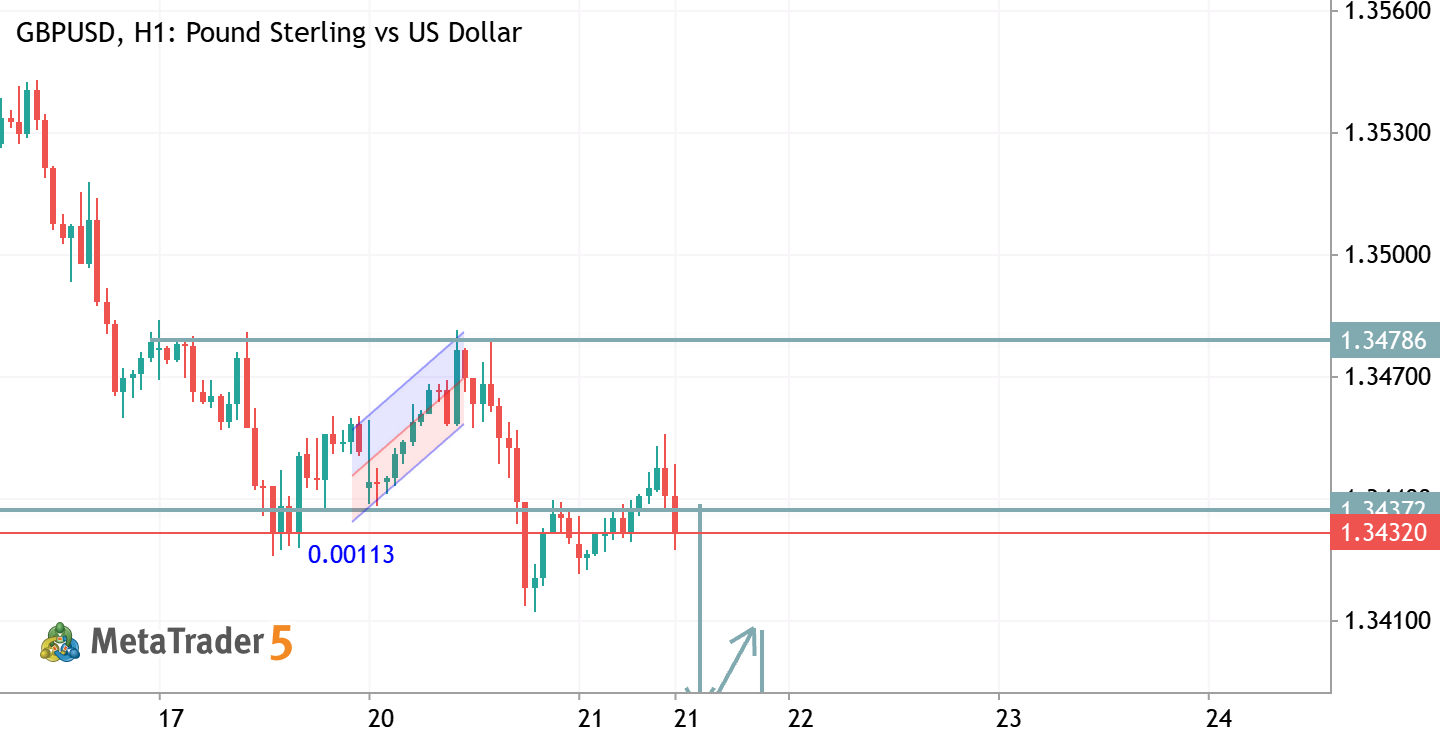
GBPUSD (H1) Bias: Bearish Based on the chart, price has rejected the 1.3478 resistance and is trading back below the 1.3437 pivot , indicating sellers are regaining control. The recent lower high and bearish momentum favor a continuation lower unless buyers reclaim resistance. Sell Entry Zone: 1.3430 – 1.3445 (on a pullback/retest) Take Profit Targets: TP1: 1.3387 (nearest support) TP2: 1.3345 (major support) Stop Loss: Above 1.3480 Bullish Invalidation: A strong H1 candle closing above 1.3478 would weaken the bearish setup and could trigger a move toward higher resistance. Your chart currently favors downside continuation toward the marked support levels. Recent GBP/USD technical commentary also notes that failure to hold above nearby resistance can keep short-term selling pressure
0

HamadJatoi Hamad Jatoi 2026.07.21 08:53
XAUUSD TRADE IDEA XAUUSD Short Gold vs US Dollar
XAUUSD TRADE IDEA
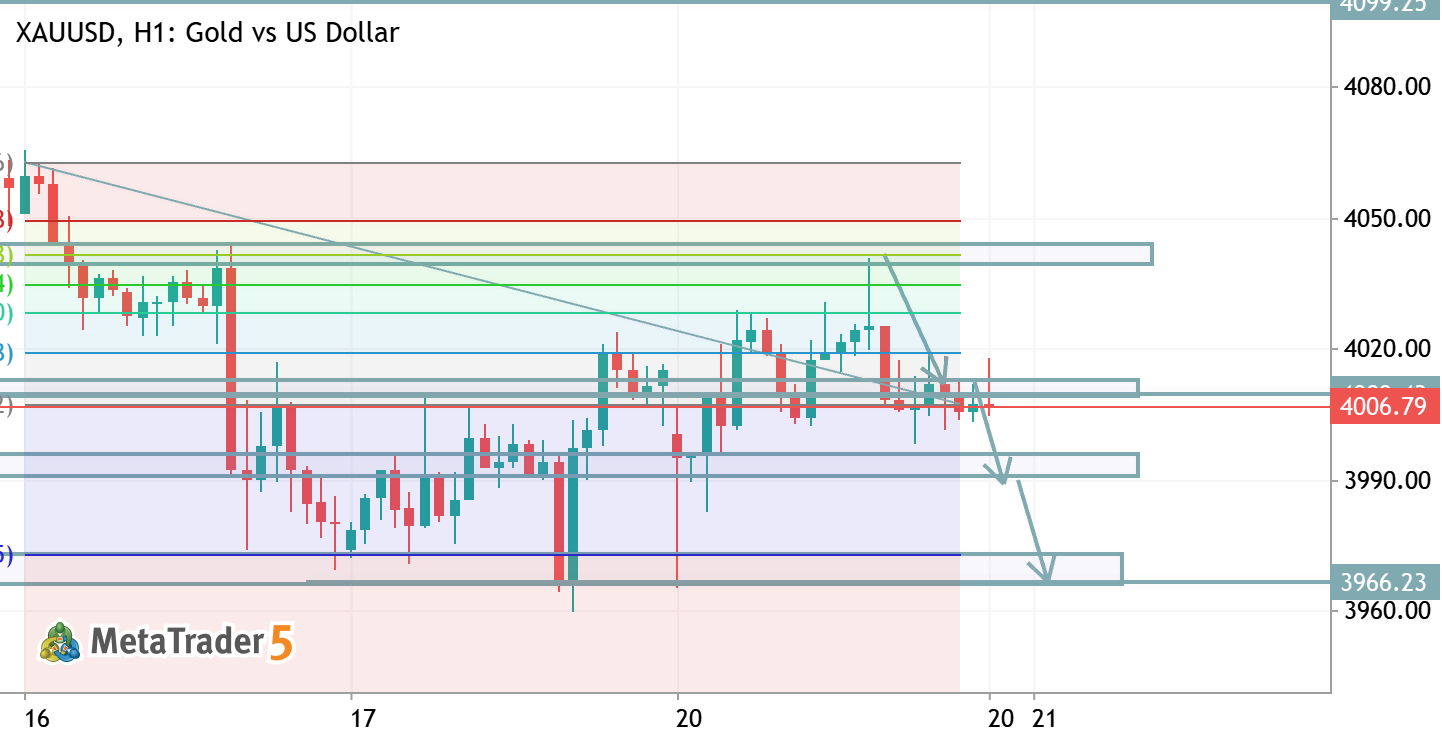
XAUUSD (H1) Bias: Bearish Trend: Price is trading below resistance and struggling to hold above the 4006–4010 support zone. Resistance: 4018–4040 (strong supply area). Support: 3995 , then 3972–3966 . Trade Idea (Sell): Entry: On rejection below 4010–4018 or a confirmed break below 4000 . Take Profit 1: 3995 Take Profit 2: 3972 Take Profit 3: 3966 Stop Loss: Above 4022–4025 . Summary: Sellers remain in control. Unless XAUUSD reclaims and closes above 4018–4025 , the probability favors a move toward 3995 and 3972–3966 .
0
HamadJatoi Hamad Jatoi 2026.07.20 20:11
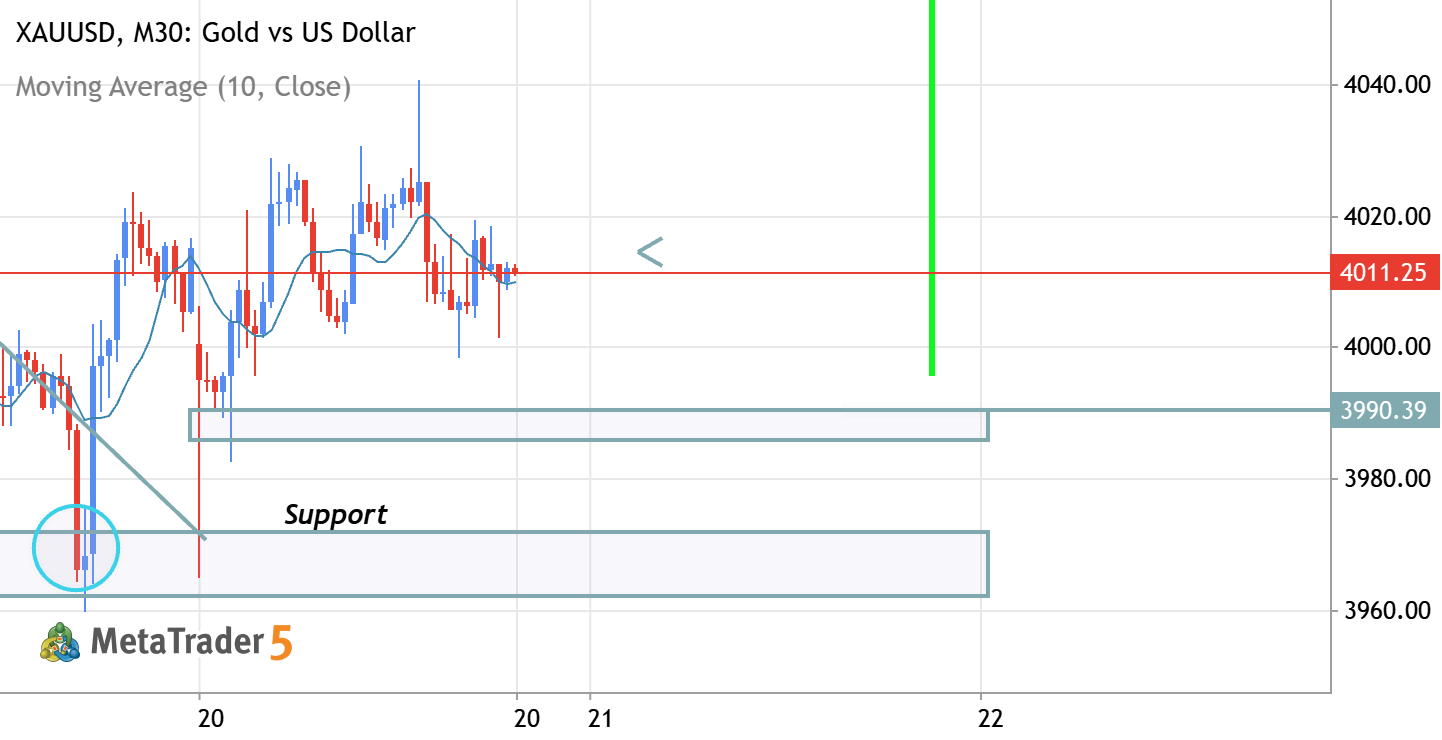
XAUUSD Bullish Recovery Toward 4088 Resistance XAUUSD Gold vs US Dollar
XAUUSD Bullish Recovery Toward 4088 Resistance
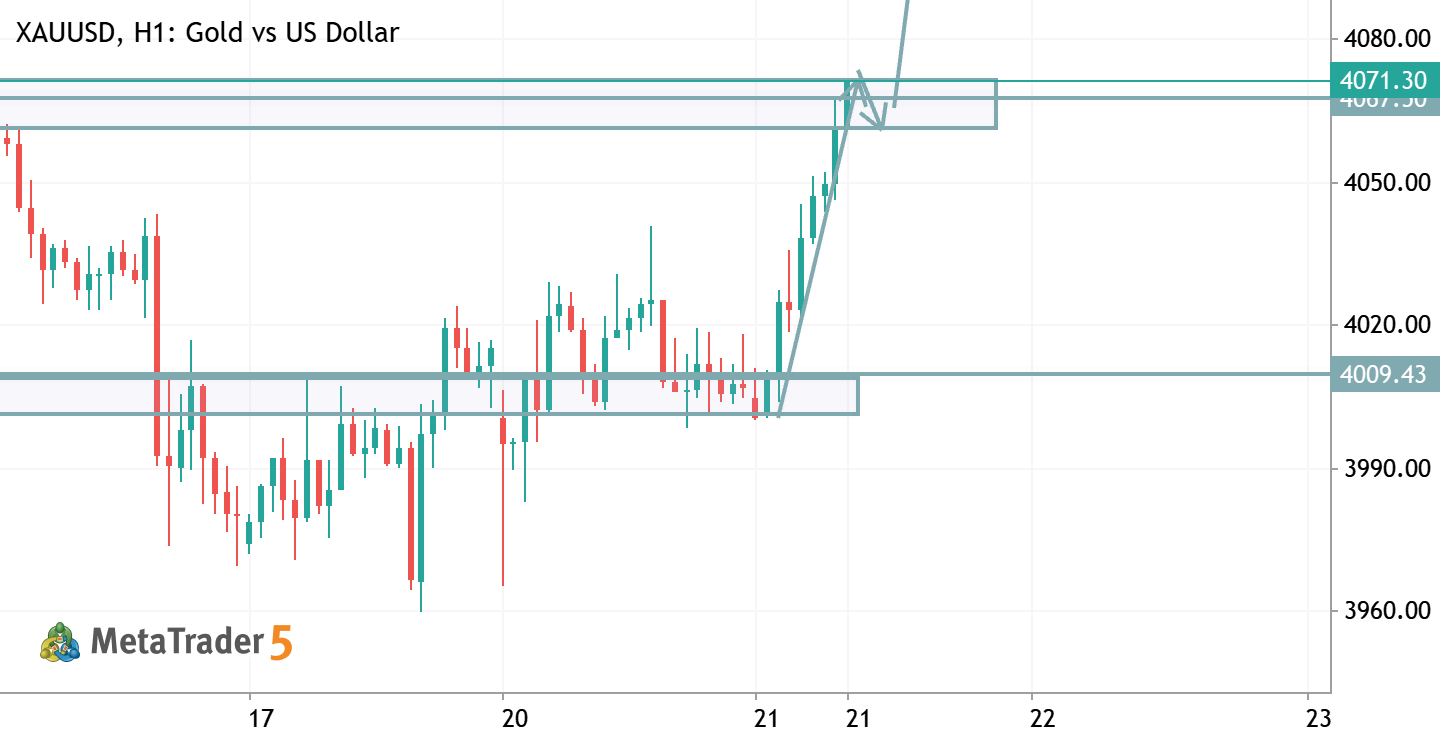
Gold (XAUUSD) is showing signs of strength after holding above the highlighted support zone and reclaiming the 4011 level. The recent price action suggests buyers are attempting to regain control following the earlier bearish trend. As long as price remains above the marked support area, the bullish scenario remains valid. A sustained move above the current range could open the path toward the next major resistance around 4088 , which is the highlighted target zone on the chart. Key Levels: Support: 3990–3980 Current Resistance: 4011 Target Zone: 4088 This analysis is based on price action and technical structure only. Markets can change quickly, so wait for confirmation before making any trading decisions and always use proper risk management. What do you think? Will gold continue its
0
SahilQazi SQS SIGNAL 2026.07.20 17:32
DAX — week of July 20 – 24, 2026; SHORT
40
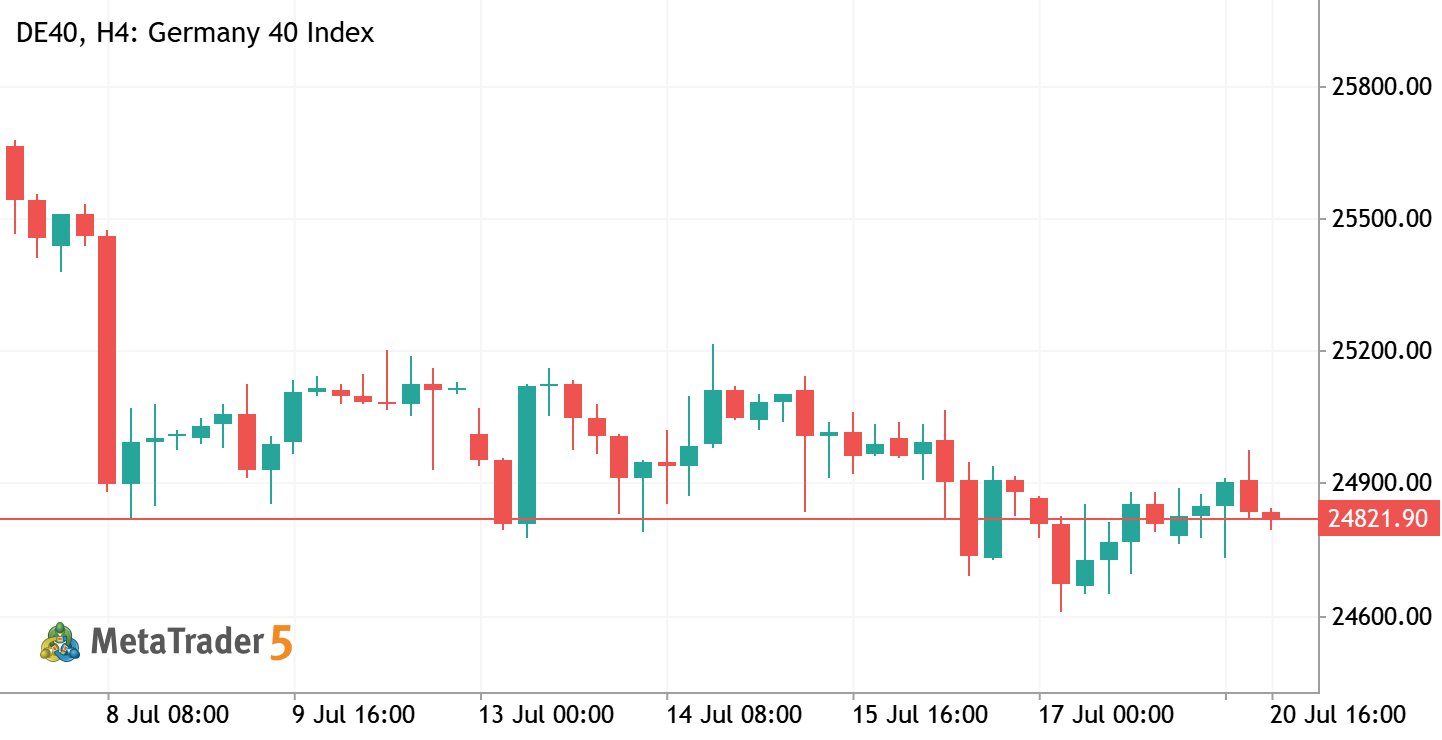
DE40 Short Germany 40 Index
DAX — week of July 20 – 24, 2026; SHORT
DAX — week of July 20 – 24, 2026 SHORT Two weeks ago the 26,064 'breakout' was a trap I called; last week the tape fade-and-flushed to 24,715 , exactly where I mapped it. Now it's coiled on the one number that matters, and almost nobody prints it: the weekly EMA ( 24,996 ), the weekly pivot ( 24,997 ), the 4H EMA ( 24,999 ) and the week's VWAP ( 24,950 ) are stacked inside a fifty-point knot at 24,950–25,000 . Price is sitting one tick above the whole cluster, bouncing a limp +0.3% off Friday's 24,715 low. That knot is the hinge — not the obvious 26,000 top, not the round 25,000 the tourists circle. Above it sits a tight ceiling: R1 at 25,279 tucked under last week's 25,343 high, a 64-point band where every bull trapped at 26,000 waits to average down. I'm a seller into 25,279–25,343 for
0
stuki Istvan Balazsa 2026.07.20 13:23
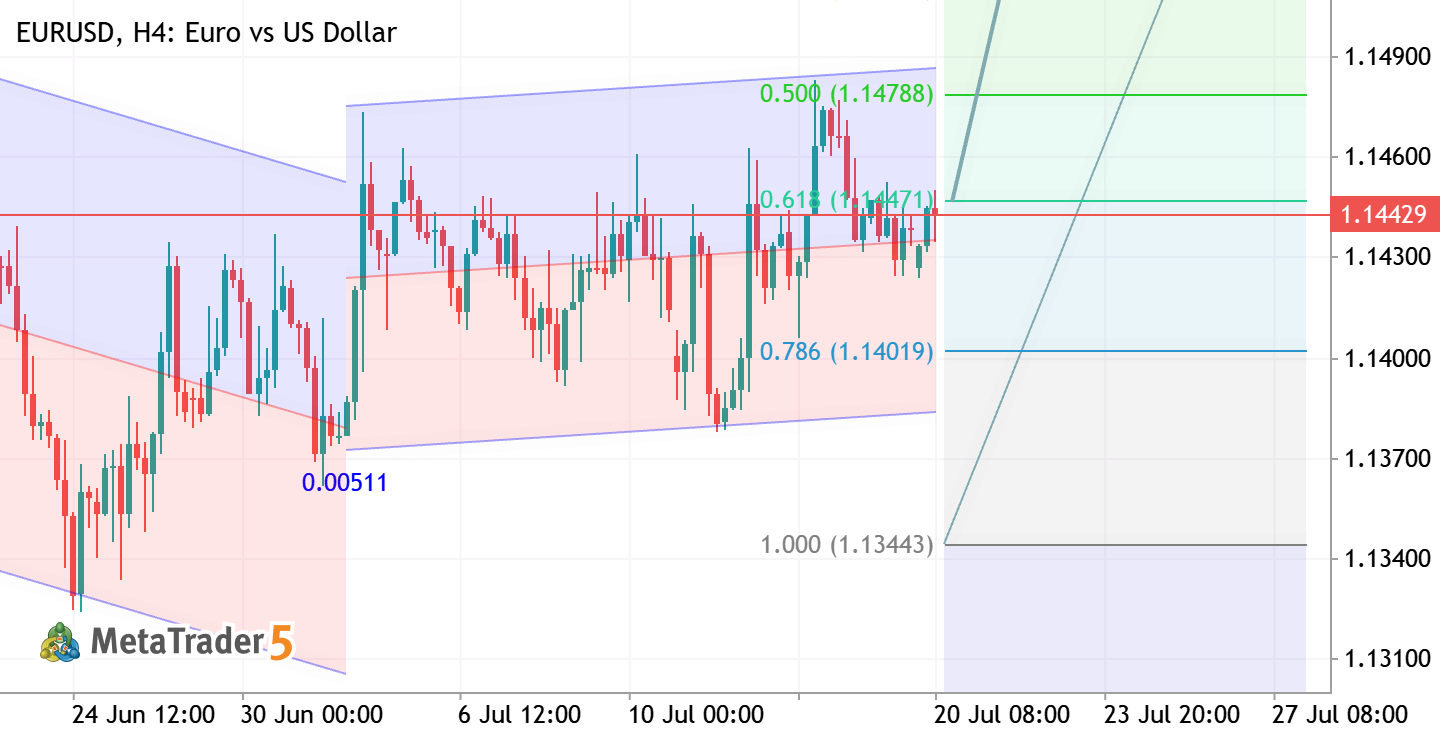
EURUSD H1 ANALYSIS EURUSD Euro vs US Dollar
EURUSD H1 ANALYSIS
EURUSD – H4 Outlook Price is holding above the key Fibonacci support zone, signaling bullish strength. As long as buyers defend 1.1400–1.1420, the pair remains positioned for a move toward 1.1615. Bias: Bullish Support: 1.1400–1.1420 Target: 1.1550 → 1.1615 A sustained hold above support keeps the upside scenario valid, while a break below 1.1400 would weaken the bullish outlook. Always wait for confirmation and apply proper risk management.
0
Goldanalysisteam Abdul Qayoom 2026.07.20 08:42
GBPUSD H1 ANALYSIS GBPUSD Pound Sterling vs US Dollar
GBPUSD H1 ANALYSIS
GBPUSD – H1 Quick Analysis Price is recovering from the Fibonacci support zone after respecting the lower boundary of the descending channel. Buyers are attempting to regain momentum, with the next focus on the channel resistance. Bias: Bullish above support. Key Resistance: 1.3465–1.3480. Key Support: 1.3400–1.3385. A confirmed breakout above the channel could trigger further upside, while rejection at resistance may lead to another pullback toward the support zone. Trade with proper risk management and wait for candle confirmation before entry.
0
Goldanalysisteam Abdul Qayoom 2026.07.20 08:28
BTCUSD H4 ANALYSIS BTCUSD Bitcoin vs US Dollar
BTCUSD H4 ANALYSIS
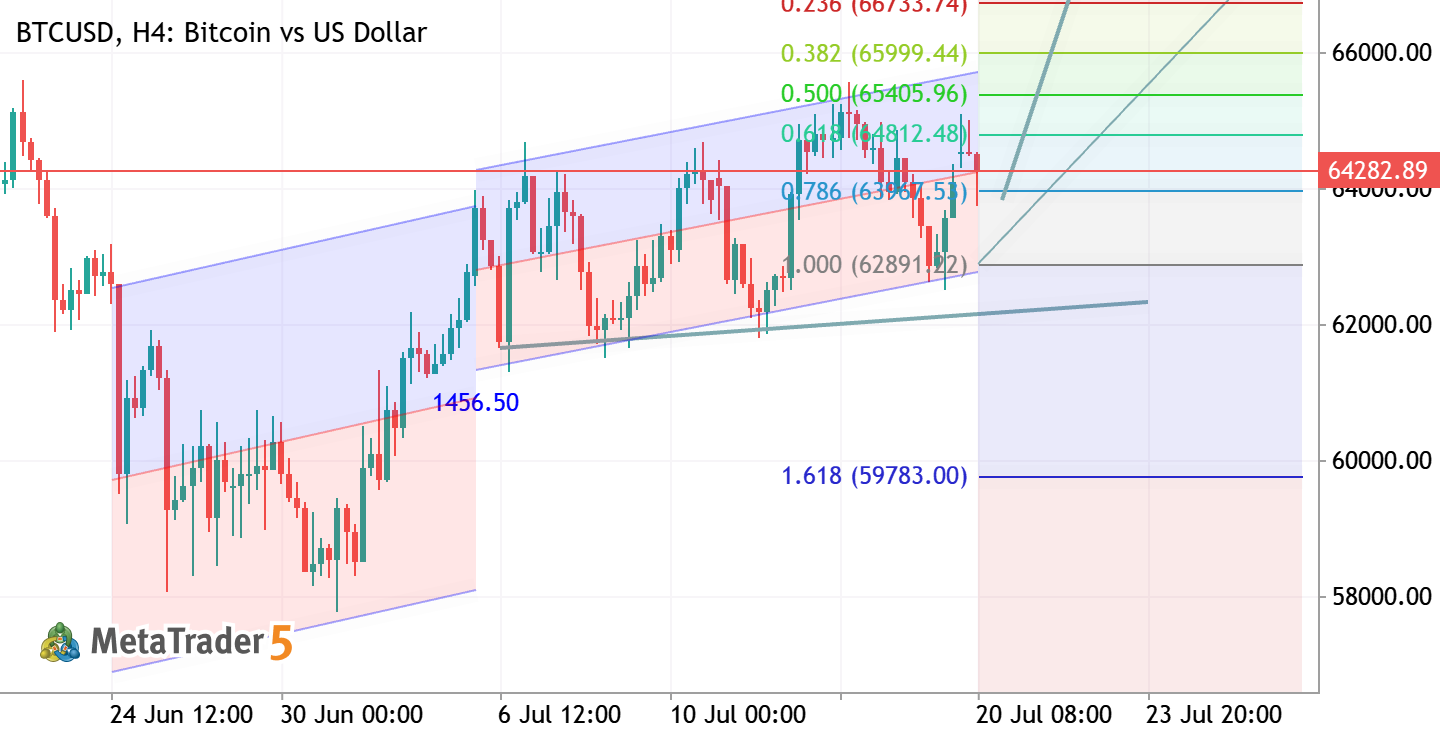
BTCUSD H4 Analysis Bitcoin remains in a strong bullish trend, trading inside an ascending channel while respecting Fibonacci support levels. As long as price holds above the key demand zone, buyers are likely to target the next resistance area. 📈 Bias: Bullish 🎯 Targets: 68,300 → 69,700 ⚠️ Key Support: 63,700–64,000 Trend remains bullish. Watch for a breakout above resistance or a pullback to support for higher-probability entries. Always manage risk.
0
Goldanalysisteam Abdul Qayoom 2026.07.20 08:17
XAUUSD H1 ANALYSIS XAUUSD Gold vs US Dollar
XAUUSD H1 ANALYSIS
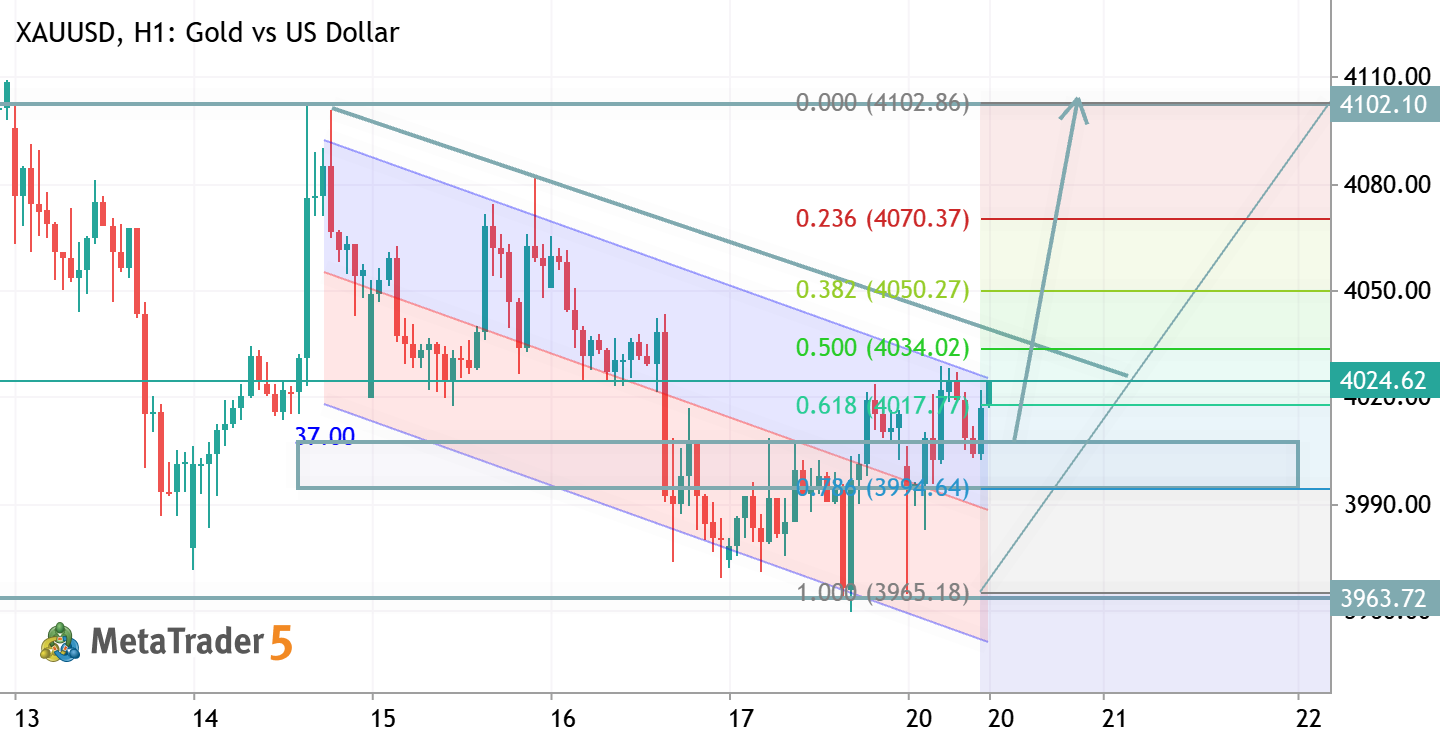
XAUUSD H1 Analysis Gold is trading within a bullish recovery structure after holding above key support. Price is approaching a major resistance zone near 4100, where a breakout could trigger the next impulsive move. A successful close above resistance would strengthen the bullish outlook. 📈 Bias: Bullish 🎯 Targets: 4100 → 4120 ⚠️ Key Support: 4000–3965 Wait for breakout confirmation or a healthy pullback before entering. Always use proper risk management.
1
Goldanalysisteam Abdul Qayoom 2026.07.20 08:09
BTCUSD TRADE IDEA BTCUSD Short Bitcoin vs US Dollar
BTCUSD TRADE IDEA
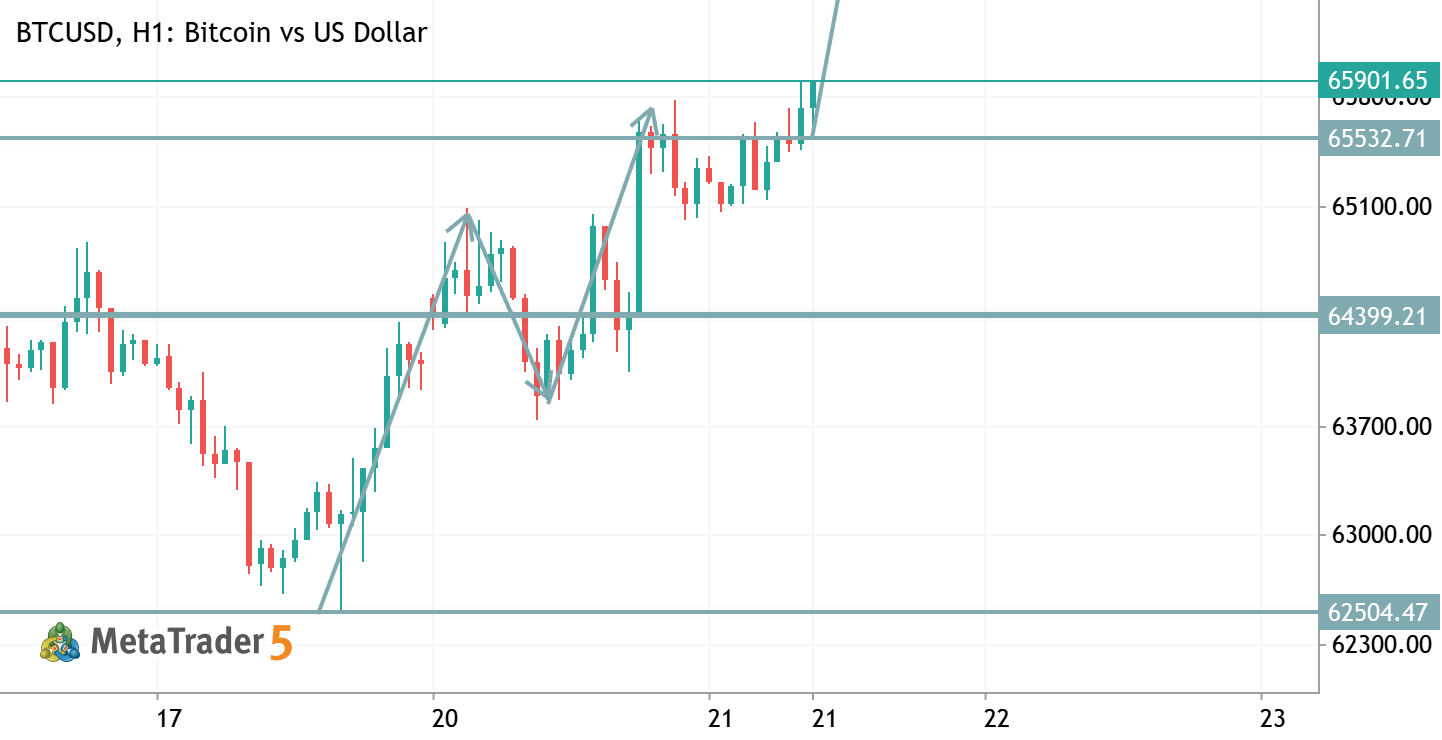
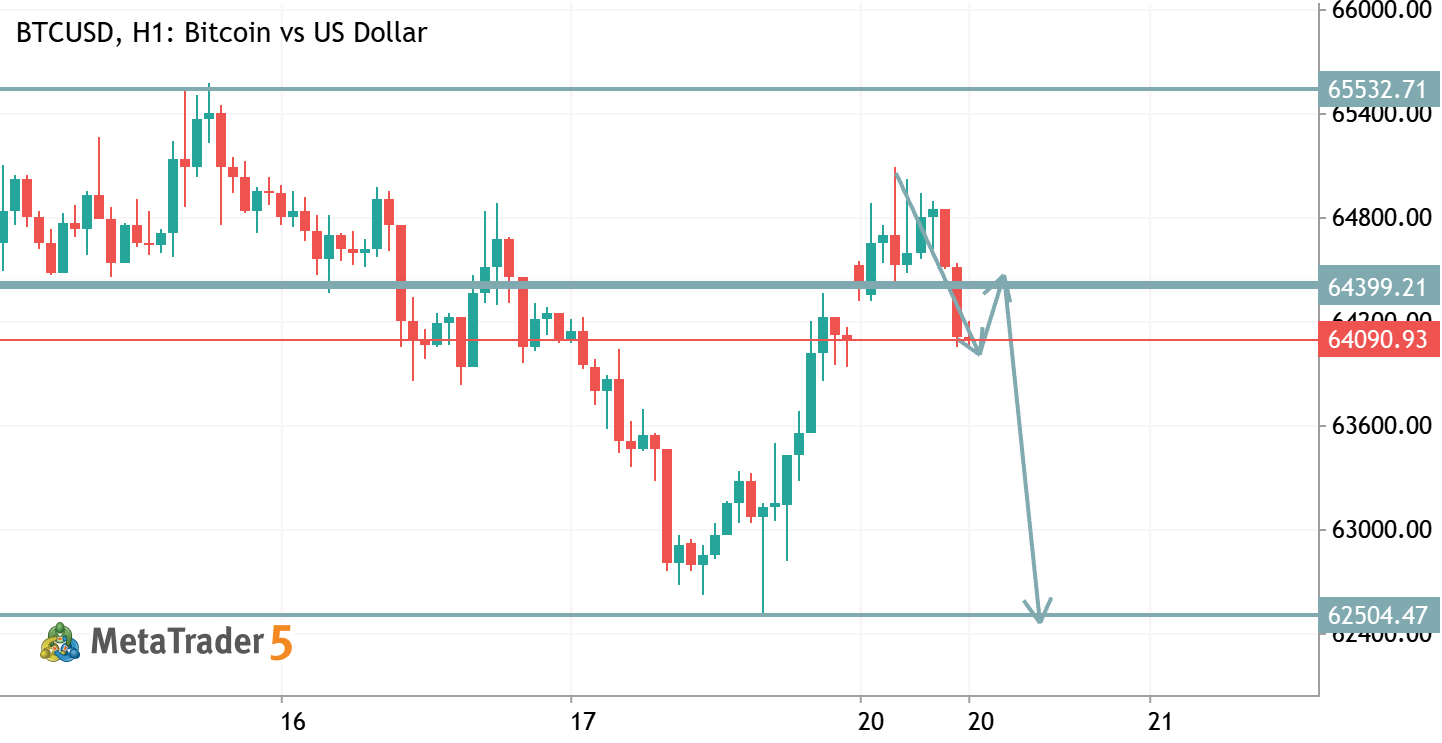
BTCUSD (H1) Bias: Bearish below 64,400 resistance. Key Resistance: 64,400 – 64,550 . Key Support: 64,160 , then 62,500 . Price is rejecting the resistance zone after a strong rally, suggesting sellers are defending this level. A confirmed H1 close below 64,160 increases the probability of a move toward 62,500 . If price breaks and closes above 64,550 , the bearish setup is invalidated and buyers may regain control. Trade Idea: Sell below 64,160 after confirmation. Targets: 63,500 → 62,500 . Stop Loss: Above 64,550 .
1
HamadJatoi Hamad Jatoi 2026.07.20 06:29